Final Report

[abstract]

This project is about modelling and visualizing maritime paths of ships from the XVIIIth Century. In this report, we explain the steps of how from a filemaker database containing historical information, we have extracted the data, created a model, stored the information in a postgresql database, computed and visualized the multiple paths from harbours to harbours along the French coast of the Atlantic Ocean.

Introduction

Digital maps have progressed a lot in the last few years and they have reached a level of detail that has never been reached before. Google, Bing, Nokia and others have made a fantastic job mapping all the world, sometimes not just by providing simple maps, but also providing a rich 3D experience, where a user can even have a street level view almost anywhere in the world. In parallel, with the advent of digital maps there has been an on-going effort to try to bring this experience in many different fields, for example with the web 2.0 contributions from projects like OpenStreetMaps and others.

People have built and used different types of maps, including maritime maps for centuries, but recent progress have been made with the apparition of digital mapping, adding a new dimension and many possibilities. Currently, people can find maritime maps and use them for navigation, but sometimes, research is not only about discovering the new, but also about a deep dive in history.

While digital maritime maps are not something of a novelty, providing a glimpse in the past is. How did people navigate in the past? What routes did they choose? This is a question that lied at the very bottom of our research. Though there are many existing projects that try to provide an insight to mapping historical maritime routes, there is no standard, or there is no common database that people can use in order to easily have access to information.

Our goal in this project was to try to provide a way in which people can view information about historical maritime maps. For research purposes, our project is based on data from the 18th century, but this does not make the project loose its general purpose. The framework that we have used and proposed in our research can easily be adapted to any period in history and people can use it to build on top of it. Our research project does not stop with these results. The results that we have obtained so far (which will be presented later in this report) are just to show the huge research potential such projects have.

Before describing our actual solution, we have done some research to see what current research projects exist and what topics do they approach.

State of the art

Since there are many interesting projects that deal with historical maritime routes, historical information about ships and historical maps, we will only present some that are relevant to the work that we have done.

One of the biggest databases on historical ships can be obtained from Navigocorpus. Navigocorpus is a database that provides information from different sources about shipping and maritime trade and their movements through time and space. The information provided is stored chronologically and can be accessed through the use of the software called Filemaker. There is also an online website where data can be accessed from, but it is not as complete as the one accessed through Filemaker 12. The way in which data from Navigocorpus looks can be seen in the image below.

Another very interesting project that deals with maritime maps and routes is ORBIS. ORBIS is a project from Stanford University and it represents a Geospatial Network Model of the Roman World. On this model it tries to reconstruct different types of travel in antiquity, including maritime travel. The model that they provide for mapping sea routes takes into account a lot of different factors, including wind conditions, currents and possible waves. The model that they have is made of 900 sea routes that is based on the book written by Pascal Arnaud. An interesting aspect of ORBIS is that they even provide different costs for travelling, depending on which month the journey has taken place in.

A question one might ask is why do we need another project that deals with historical maritime routes. The reason behind our project is that, first of all, the data provided is easily accessible, but not so easily accessible for future development. Data can be accessed through their map and it provides an interface with different parameters and it produces routes. Data can even be exported, but this does not help much.

How can we add different data? How can we use their model and build on top of it? Our project involves two aspects in order to produce maritime routes. One is data collection and one is data visualisation. Since there is no real access to the database ORBIS is using, we cannot make much use of their approach in our project. However, we can use it to compare some of the results that we have.

Further on, we will describe our solution, the challenges that we have faced, how we have solved them and the future research questions that still remain open.

Project Goal

The goal of our project is to propose a data model for maritime routes, by storing information about ships, harbours, dates when ships have travelled to those harbours etc., and to create a visualisation method that others can use for future research or even for educational purposes. This visualisation imposes finding an algorithm to map paths between two harbours.

Our project has two major components:

–          Data collection

–          Data visualisation & Route planning

Data Collection

One of the biggest challenges for such a project is getting data. Since our project is small with limited resources, we have decided to try to find and use an already existing database. The work done by Navigocorpus was exactly what we were looking for. The data that they provide contains information about ships, captains, harbours, shipment, tonnage and so on. This data was perfect for the kind of research we are doing.

Since we have found a source for our data, we have created a database using PostgreSQL and the spatial extension PostGIS. Having our own database structure is much more flexible to work with, we can alter data however we want, we can create, merge, query tables without having to deal with the limitations imposed by other projects (e.g. Navigocorpus allows only basic querying, we cannot build complicated queries).

From our research, we have reached the conclusion that our data model will consist of 5 tables. These tables are: “ships”, “captains”, “ships_captains”, “maritime_routes” and “harbours”.

The “ships” table is used to store information about each ship. For the moment we only record the id and the name of the ship. The “captains” table is similar to the ships table, holding the id and the name of captains. In a very similar way we have designed the tables “harbours” which has an id field and a name.  The “harbours” table is a bit different for the rest because it also contains a filed for geo referencing, the location. The “location” field is a specific data type used in PostGIS; it is a specific data type called “geometry”. This data type allows storing both the latitude and the longitude of a point’s coordinates into a single field. A more important table is the “ships_captains” table. It stores specific combinations of captains and ships. The last and the most important table from our database schema is the “maritime_routes” one. This entity has a composite key, composed of an id and a sequence_id, which is being used to identify all the routes that ships took. The sequence_id field is perticulary useful when we want to track the specific route a ship took while delivering the goods.

The database model can also be viewed in the diagram below:

Database model together with auxiliary tables

Database model together with auxiliary tables

Our database has been populated with several harbours and ships, as it can be seen below.

List of ships and the harbours they have visited

List of ships and the harbours they have visited

"Destin" routes

“Destin” routes

The database also contains another table, which stores the coastline of the map. This is not mentioned in the db model because it is not really part of the actual data, but will be further used to find maritime paths.

Data Visualisation & Route Planning

In this section we will describe the way in which we perform route planning and some results of our experiments using a data visualisation tool (Quantum GIS).

For the route-planning problem we have created two different approaches:

1.      Use buffers to identify potential paths

2.    Use an algorithm, designed and implemented by us, that can identify routes based on the starting harbour, ending harbour and by knowing where the coastline is.

1.      Buffers

In geographic science, buffers are areas of influence around a point which can include specific properties. For our case, this was the first idea of how to map these routes. The goal was to define a minimal and a maximal distance from the shore.

We defined the minimal distance as the range of traditional artillery from the XVIIIth century (maritime and coast) like 36-pounders long guns which had a range of a nautical mile (1’852m).

We defined the maximal distance as the usual “cabotage” (short shipping travels for a same country) distance from the shore as a distance of 20 nautical miles (~40km)

This leads us to the following result:

2.      Route planning algorithm

While trying to identify a way in which we can create maritime paths between harbours, we have notice that not much information about making such routes is available online.

As a result, we have decided to try and build our own algorithm and compare it with our other approach (using buffers) and with some historical based routing algorithms (those available on ORBIS’s website).

In this approach, we have not used a graph based implementation (have a set of predefined edges/paths and then just perform a minimum distance algorithm that will return a minimum path). A graph based implementation involves a huge amount of a priori work to define the possible paths. ORBIS works in a similar way and its edges/paths are based on historical information.  In our approach, we have tried to see if there is an automatic way to generate routes knowing only the position of the harbours (start and finish) and the coastline.

Based on the description provided, below, our algorithm was designed as a function in PostgreSQL. The function takes as input the ids of the harbours and it returns a geometry field that represents the path between the two harbours.

Input: (h1:harbour, h2:harbour, coastline)
Output: (result_path: geometry)
getMaritimePath()
{
create output table path_points
currentPoint = h1
line = st_makeline(currentPoint, h2)
while st_intersects(line, coastline)
{
intersection = st_intersection(line, coastline)
closestPoint = st_closestpoint(currentPoint, intersection);
newline = st_makeline(currentPoint, closestPoint);
newPoint = st_line_interpolate_point(newLine);
// also use a counter as a safety to end the loop
           while st_intersects(st_makeline(currentPoint, newPoint),coastline)
{
// try to place point right
newPoint = st_line_interpolate_point(newline, right);
}
// also use a counter as a safety to end the loop
while st_intersects(st_makeline(currentPoint, newPoint),coastline)
{
// try to place point left
newPoint = st_line_interpolate_point(newline, left);
}
insert(newPoint, path_points);
currentPoint = newPoint;
}
// Create a geometry out of all the intermediary points
return st_makeline(path_points);

The algorithm above is described in a very rough pseudo code. The actual code is provided as an attachment. The basic idea is the following. If there is no direct link between the start and finish, then we find where the intersection is. We get the closest point of the intersection and create a line between this point and start. We try to position the new point at a certain length from the start, either to the left or to the right of the newly created line. If the new point is validated, we set this as the start and start over. The algorithm finished when there is no intersection with the coastline, so it means that the path has been found.

The function described earlier uses some of the following PostGIS specific functions: (the code box below allows scrolling to view the whole content)

st_makeline(geom g1, geom g2) : create a new segment based on 2 points expressed as a geometry
st_intersects(geom g1, geom g2) : returns a Boolean which tells if there is an intersection between the two geometries
st_intersection(geom g1, geom g2) : returns a set of points as a geometry which represents the actual intersection between the two geometries
st_closestpoint(geom g1, geom g2) : returns a point from g2 which is the closest to g1
st_line_interpolate_point           (geom g, m_offset, m_distance) : returns a new point that is at m_offset% from the segment and at m_distance from the segment (g).

Depending on the m_offset and m_distance parameter, the results can very a bit. A small m_distance will lead to more point, thus a smoother path, since the distance covered until the destination (end harbour) is less.

Below, you can see some of the results that we have obtained. Each picture represents a path that is being computer based on the algorithm described previously. Depending on the parameters of the st_interpolate_line function, the path can be smoother or “edgier”.

Saint Pierre

Saint Pierre

Saint Pierre

Saint Pierre

Saint Pierre

Saint Pierre

Destin

Destin

Destin

Destin

Antoinette

Antoinette

The algorithm is far from perfect. As one can see, it does generate quite good paths, but it does not take into account complex factors like wind or maybe depth of the water. The algorithm can be further improved and we believe that it can give much better results if we keep working on it. This demo was just to show that with minimal information available (just harbours and coastline) one can generate possible routes and can reveal the paths of ships.

Conclusion

The goal of this project was to realize some visualization of maritime ships from the XVIIIth century, using the data from the Navigocorpus database, to design and implement a postgresql database with its postgis extension to store the geographical component and to reuse it then to compute and map the maritime paths. We georeferenced the harbours using google earth and with help of some GIS programs and we achieved to draw some pathlines using postgis functions.

We have seen that mapping these paths is very difficult, the main informations which are used in other projects are the streams, the historical sailing points and of course the shortest / quickest paths which were the best arguments to assess whether or not a ship was travelling along a specific path.

There’s a big potential of development in this domain, with this project we tried to go as far as possible.

Special Thanks to

Prof. Frédéric Kaplan (DH Lab EPFL)

Mélanie Fournier (DH Lab EPFL)

Prof. Silvia Marzagalli (Université de Nice et responsable Navigocorpus)

_____________________________________________________________________

SQL source code: https://dl.dropboxusercontent.com/u/70900477/source_code.zip

_____________________________________________________________________

References:

1. Navigocorpus: http://navigocorpus.org/Presentation/Database

2. ORBIS: http://orbis.stanford.edu/#

3. PostGIS documentation: http://postgis.net/documentation/

4. PostgreSQL: http://www.postgresql.org/docs/9.3/static/index.html

5. Quantum GIS Buffers: http://docs.qgis.org/2.0/html/en/docs/gentle_gis_introduction/09_vector_spatial_analysis_buffers.html

6. PostGIS interpolate point along a line

http://gis.stackexchange.com/questions/33478/how-to-offset-point-perpendicular-to-line-direction-in-postgis

http://trac.osgeo.org/postgis/wiki/UsersWikiExamplesInterpolateWithOffset

Blog Post No. 3

The purpose of this blog post is to show the progress on our project. First of all, as we have said in the 2nd blog post our main goal has shifted. The original timetable was designed in a way that the final objective of the project is data visualization.

 Data visualization is still a goal of our project, but while doing some in depth research on maritime routes we have seen that the automatic generation of route plans is not so well developed. As a conclusion, our project will have 2 goals, the second being based on the first on:

 – Create a way in which routes can be automatically generated based on a list of visited harbors while knowing the boundaries of sea/land

 – Visualize the routes generated from the goal above. This is also a way to validate the algorithm proposed in the previous goal.

 Since our second report, we have focused our research towards generating maritime routes. We have already found some software that can create routes, but most of them are manual (e.g. we can use OpenSeaMap.org to manually create a route and the export it in KML format or other common used formats). We have also found some professional navigation devices made by Garmin or Magellan (e.g. Garmin eTrex Venture HC GPS Receiver), but they cannot be used for the purpose that we are interested in.

 These aspects have made us try and design our own “maritime route planner” that will be used for the precise purpose of our project and with possible extensions to any future maritime route planning projects. The biggest problem that we are currently facing is how to avoid “crossing” land. This situation has been described in the previous blog post. In order to solve this problem we have conceived the following algorithm (which will be later improved):

 – If the route between A and B does not intersect the land => everything is OK

 – Else: take the point that intersects the segment between A and B and the land. Create a new point (A’) that lies on the perpendicular of AB, starting from the intersection point, at a certain distance (best distance can be determined from experiments)

 – After the new point has been added, take this as the starting point and redo the algorithm until no more conflicts.

 – The list of resulting points will be the intermediary points for the maritime route.

algorithm

 We have also done some experiments using GIS software. For example determine buffers to illustrate the distances to the shore. This was our first idea to draw semi automatically our pathlines. Here we visualise the distances between 2000m and 3000m to the shore, which corresponds more or less to the range of a 36-pounder long gun of the XVIIIth century (practical 1600m, max 3700m, see “Jean Boudriot et Hubert Berti, L’Artillerie de mer : marine française 1650-1850, Paris, éditions Ancre, 1992” for more details) .

Antoine_Morel-Fatio_pl10

Using the openstreetmap data for the shore, we faced some problems like the non completion of the polylines, and to create multiple buffers, the number of polylines created per multiple users/contributors was so high that it was too expensive to compute buffers for each segment. The solution to this problem was to merge these segments and then draw only one buffer  for the entire polyline.

map

We are actually in the final part of our project, the last steps will be the following:

  • code and run our algorithm,

  • set a form to visualise our data

Progress Report No. 2

The purpose of this second blog post is to show our project progress, the problems that we have encountered and the choices we have made to counter them. Our project has evolved from design to implementation. We have successfully implemented the database, we have made the connection between the database and the GIS software, we have added georeferencing to some harbours and we have implemented an initial way to display the path a ship took between some harbours. Further on in this post we will present each of these realizations in more detail, but first we shall discuss some of the feedback that we have received on the first report. This is important because it is closely related to some of the design decisions that we took for our project.

Firstly, about two weeks ago we have managed to get in contact with Silvia Marzagalli who is a member of the team working on the Navigocorpus project. With her help we have managed to access more information from the Navigocorpus database. From this point of view, we will change the direction of our project. It will no longer be a mostly data collection oriented, but we will focus on ways to identify possible maritime routes. The database model that we have designed was just a prototype in terms of the attributes that each table has. We believe that with the structure that we have designed we are able to track the route between ports of each ship. We do agree that we could also add more valuable information like port of registry, ship owner, ship type, type of cargo etc., but unfortunately, the database provided from Navigocorpus is quite sparse when it comes to these kinds of details. However, we are lucky that the database does contain valuable information that we can use to predict routes. As a result, we think that the database model is sufficient for trying to predict maritime routes.

Second of all, during the past few weeks, we had an interesting discussion with Melanie Fournier who is working in the DH-lab at EPFL about the main goals of our project. Based on her experience and knowledge in maritime mapping she has also suggested that if we manage to access the Navigocorpus database, our effort should focus towards finding the pathlines that the ships have used while navigating.

Now we can go into some of the technical details of our project.

We have managed to access the database of Navigocorpus using Filemaker 12. With this software we can explore the entire database,  reading attributes like captain name, boat name or harbours. We have seen that in practice, the database shows some issues because some ships have the same names even though they are actually different. This makes automatic data processing very difficult and could easily lead to errors. We could try a date filtering, but the date field is not exact for a lot of the entries present. Another issue is that some results are not complete, so it’s not always possible to draw a continuous path between the harbours.

We have managed to implement the database using PostgreSQL and PostGIS spatial extension. We have decided to drop the “goods” table proposed in the previous report due to the lack of sufficient data. Based on the database that we have implemented we can see the routes in the following way:

"Destin" routs

“Destin” routes


This information is viewd by using the following query: 

select mr.id as id, mr.sequence_id, c.name as captain_name, 
h.name as habrour_name, mr.in_date, mr.out_date
from maritime_routes mr
join ships_captains sc on mr.ship_capt_id = sc.id
join ships s on sc.ship_id = s.id
join captains c on sc.captain_id = c.id
join harbour h on mr.harbour_id = h.id

As an example, we have chosen the “destin” ship to gather some data from Navigocorpus and we have tried to fit the data into our model and database, for this purpose, we had to geolocalise the harbours present in the database using Google Earth.

mapdestin_xml

Once the database was online on localhost, we have used the postgis layer to draw the points on a map. We have used OSM cloudmade data to extract the coastlines from the OSM file to a simple shape vector layer. After this, we could trace the links between the harbours. Tracing the links between the harbors has been achieved automatically by creating the links directly from the database in PostgreSQL. This is just an initial way to connect them which tests the basic idea of connecting successive points and it was a very useful especially for integrating all the different software that we are using.

The initial trace can be seen in the images below.
trace2 trace1

The trace is achieved using the query below. The information is first grouped by route, then the sequence of visited ports is sorted ascending and based on the harbours (set of points) we get the trace using the PostGIS function “st_makeline”.

create table line_test as
select mr.id as id, st_makeline(h.location) as line
from maritime_routes mr
join ships_captains sc on mr.ship_capt_id = sc.id
join ships s on sc.ship_id = s.id
join captains c on sc.captain_id = c.id
join harbour h on mr.harbour_id = h.id
group by mr.id
order by 2 ASC

Now that we know that the we can use the data from PostgreSQL and display it in QuantumGIS we can start focusing on finding an algorithm to find the approximative maritime paths.

Progress Report No. 1

The purpose of this blog post is to keep track of the work that we have done so far to our project. This post will deal with some of the progress that we have made, as well as some of the problems that we are facing at the moment.

The project that we are trying to develop is based on an underlying database. From our research, we have reached the conclusion that our data model will consist of 6 tables. These tables are: “ships”, “captains”, “ships_captains”, “maritime_router”, “harbours” and “goods”.

The “ships” table is used to store information about each ship. For the moment we only record the id and the name of the ship. The “captains” table is similar to the ships table, holding the id and the name of captains. In a very similar way we have designed the tables “harbours” and “goods” which have an id field and a name.  The “harbours” table is a bit different for the rest because it also contains a filed for geo referencing, the location. The “location” field is a specific data type used in PostGIS; it is a specific data type called “geometry”. This data type allows storing both the latitude and the longitude of a point’s coordinates into a single field. A more important table is the “ships_captains” table. It stores specific combinations of captains and ships. The last and the most important table from our database schema is the “maritime_routes” one. This entity has a composite key, composed of an id and a sequence_id, which is being used to identify all the routes that ships took. The sequence_id field is perticulary useful when we want to track the specific route a ship took while delivering the goods.

The database model can also be viewed in the diagram below:

Database model

Database model

We have also started the data acquisition process. Since data acquisition is a manual procedure, it takes a lot of time and we have not found an automatic way to do it. We are collecting our data from the Navigocorpus web interface and based on the harbors where a ship has traveled, we manually collect the geo spatial coordinates of that harbor using Google Earth. Our goal is to collect data about 20 different ships and for each of these ships 2 or 3 routes that it travelled on.

We have tried to contact the Navigocorpus team in order to gain access to the database that they are using, but so far, we have not managed to obtain any favorable results in this direction.

One of the problems that we face is a geographical issue to map our ships travelling on the seas. The link between the spatial positions of the harbors is not defined and the Google maps and openstreetmap does not allow us to use the classical path finders (which are using roads and paths but not maritime paths). The direct connection of two harbours (see figure below) makes no sense because the ships cannot sail over land.

Map1

Connecting two points based on closest distance between them

In the 18th century, people were not using GPS but celestial navigation. Except for the time when they navigated over the Atlantic Ocean, there was no need to go far away from the shores, so we might actual infer a route close to the coastlines. Our idea is to use Geographical Information Systems (GIS) to classify (e.g a part of Europe) what is ground and what is water and apply a so called “buffer”. This buffer would give us a minimal safety distance from the shores which ships might have used to navigate.

Map2

View of the buffer zone

From the development point of view of the project, we are on schedule. We have planned a total of 5 weeks for the data acquisition and the data modeling.  By the end of the 5th week we should have finished data acquisition, all test data should be in the database and we should be able to proceed to data visualization.

Project plan and milestones

Our plan is made with respect to the plan presented in the methodology.

1.     Data acquisition

Milestone:  

  • Gather enough data that so that we can provide 2-3 samples of the running application

Time: 2 weeks

2.     Data model

Milestones:

  • Create the data model
  • Put the gathered information in the database

Time: 3 weeks

3.     Data visualization

Milestones:

  • Provide QuantumGIS visualization
  • Provide web visualization

Time: 3 weeks

4.     Analysis and testing

Milestones:

  • Check gathered data
  • Verify database model
  • Verify visualisation components
  • Integration testing

Time: 2 weeks

5.     Conclusions and future work

Milestone:

  • Publish results
  • Make application available online

Time: 1 week

Estimated time required to complete project: 11 weeks

Extra time allowed: 2 weeks

Methodology

This post will describe the way in which we are going to develop our project. A very important part will be finding / acquiring data. For this purpose we will try to use logbooks that ships use. Further on we will develop a model to store data, then we will visualize it and last but not least, test and analyze our work. All of these steps are described in more detail below.

1. Data Acquisition

The focus of this project is gathering spatial and temporal data from maritime logbooks, from the 18th century. The data that we gather will be related to a specific sea or area from Europe (e.g. the Mediterranean sea). The information provided by the logbooks have already been centralised and gathered in another research project which is called “Navigocorpus”. The data is stored in a textual database which is available online in a filemaker format. The data can be queried by simply navigating the project’s website (http://navigocorpus.org/), searching for the name of one boat or the name of a captain. This seems easy enough, but the information provided is not so detailed, there is no geographical information (exact GPS coordinates), we can only retrieve names of ships, harbors etc. We intend to improve this aspect by merging both exact positioning with the information gathered from Navigocorpus. As a result, the data acquisition will be separated in two different parts.

Firstly, we will select the boats of interest, looking for ships where more data is available. The data is gathered mainly in commercial harbours logbooks, so we can extract the contains of these ships and the harbours of interest.

Then, we propose to extract the geographical information, the exact position of these harbours and further approximate the commercial maritime routes on a standard web GIS platform like Google Maps or OpenStreetMap. We will store the visualization data as shapefiles, as layers on the globe for points and polylines on Quantum GIS. The data will be stored in a PostgreSQL database with the PostGIS extension.

2. Data model

Data acquisition can be a very long and tedious process. Not only it involves finding the right source of information, it also implies properly understanding it and then finding a way in which you can encode the essential information.

In order to store the map information we will use a database. Our database will be built similarly to the database used by Open Street Map (OSM). OSM is an open source project, which provides very detailed mapping of the entire world. They even provide a nautical map, called the Open Sea Map. The reason for this choice is because we want our data model to be compatible with existing standards. Having a very specific model that no one will use in the future will not receive positive feedback from the mapping community.

The database of Open Street Map uses tables to describe the primitives of the map. Some of the primitives in the OSM map are: nodes (they define one point in space), ways (define linear features and areas) and relations (they are used to define roles between other elements). All other elements are defined using these primitives (e.g. a street is described using several ways) and all the elements can have tags associated, which have the following format: (key, value). The Open Sea Map is provided as an extension to Open Street Map and the data model respects the standard imposed by the International Hydrographic Organization (IHO-S-57).

We will build our map, from the data that we have previously collected, using the same structure for data.

From the technological point of view, our database will be stored using PostgreSQL. This software is a powerful, open-source object-relational database system. Together with the spatial extension, PostGIS, PostgreSQL allows handling and storing spatial information. PostGIS is also an open-source software program that adds support for geographic objects to the PostgreSQL database. It offers features like computing the area, distance, perimeter and even intersections between geometric objects.

3. Data visualisation

To obtain the data visualisation, we will use two different approaches.

The first one will be a standard GIS approach with a GIS software. We choose Quantum GIS for its capacity to visualize easily datas from a postgreSQL / postGIS database and the fact that it’s open source and contains a python console and many extensions made from the users all around the world.

The second one is based on a webGIS development tool which is called i2maps and which has been developed by Christian Kaiser and al. from the National Centre for Geocomputation ( at NUI Maynooth). Christian Kaiser is also professor at the University of Lausanne (UNIL). The main idea of this tool is to combine javascript and python together to visualize informations on a standard web browser. This could lead us to the creation of a small web platform displaying old navy ships travelling around space and time.

4. Analysis and testing

Once we have finished acquiring data, proposing a model and visualizing it, we have to test it and analyze it.

The testing part will be divided into two parts: unit testing and integration testing. We will first test each module, independently, and see if it works properly and if we have achieved the desired result. After we have tested each component we can test our whole system and check if everything works well together.

Once the software part is working properly, we have to analyze if what we have created is indeed what we intended to create.  Our plan is to propose a way (a standard) in which old maritime maps can be stored and visualized.  Since a standard involves a community of people, we will set-up a website and see if we can attract opinions from peers in the mapping community. These could provide essential feedback about the project and it will give is insight if what we are doing will be useful for others or not.

5. Conclusions and future research

The final part of the project is to see if we have met our objectives and what else can be done in the future. We will verify if the feedback received from the mapping community is positive and based on this feedback we could address some issues that could be further developed.

From the user point of view, this project will provide a website with a demo of our work which anyone can use. Based on this demo, people will be able to view a digital version of an old maritime map, query it and visualize some information. We will also provide a feedback form that will, again, be useful in the future.

Research question: Why digitize old maritime maps?

Map of the Mediterranean Sea (XIX century)

Maps nowadays provide a very accurate representation of the environment. Whether it is a standard navigation map, a maritime map or any other type of map, most of them are available online and can be browsed by almost anyone. These maps are digital and people can perform certain queries to retrieve information. Such queries could refer to the location of specific objectives (countries, cities, roads, points of interest etc.) or they could refer to finding a route between two points on the map (e.g. the route between Lausanne and Geneva).

Similarly to standard navigation maps, maritime maps provide precious information that people can use when “driving” a boat, offering a detailed representation of a specific area. This data is very useful when you want up to date information, however, sometimes, in order to understand the “present”, first you must be able to understand the past.

We know that throughout history, ships were used for commercial purposes and goods were transported from one place to the other. Understanding these routes could explain connections between countries, people and the way in which they used to trade. The problem with old maritime maps is that they aren’t so accurate and that they also require a lot of time and effort to read them, no to mention understanding them. Having a collection of such maps in digital format and widely available would mean that a lot of people could have access to them and use them.

We want to propose a research project that will be concentrated on proposing a way in which we can digitize old maritime maps and make them available to everyone.

The most important reasons for such a project are:

  • There are very few digital databases about old maritime maps, none of them being widely available
  • There is no standard for describing old maritime data
  • Old maritime maps could provide extremely important research information with respect to some historical aspects

Our objectives for this project are:

  • Collect some sample data from a specific area (e.g. a map of the Mediterranean sea from the XVIII-th century)
  • Choose which is the data that will be represented
  • Propose a data representation model for old maritime maps
  • Propose a data visualisation for the gathered data
  • Provide some sample queries and sample visualisations of the collected data

Photo source: website

State of the art: Mapping seas around the world

[Abstract]

Maritine maps can be Nautical Charts, graphical / historical representations or “virtual” via the logbooks. The projection of the maps is quite important because it makes the difference between a simple painting of the globe and a map with spatial references. Actually, the OpenSeaMap project is focusing on mapping the nautical charts around the globe! The Navigocorpus project is focusing on creating a Geographical Information System  (GIS) Database from old archives. The CLIWOC project is focusing on extracting the meteorological information to a geographical database.

Introduction

Our subject focuses on old maritime maps, that’s why we investigate to gather some information about what has already been done and what are the actual projects in this domain.

Firstly, we must differentiate the maritime maps. There are nautical charts containing all relevant information for sailing and the graphical historical representations on large paintings. To that, we can add all the old navigation and commercial journals (logbooks) which linked together can form virtual maps for all the maritime cruises.

Nautical Charts

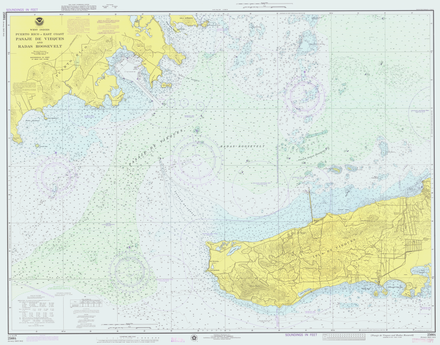
“A nautical chart, also known as a maritime map, is a representation of a maritime area and its adjacent costal regions.” (Wikipedia, Nautical Chart, 2012) The chart can display a lot of information depending on its scale. You may find information about the depth of the water, details of the coastline, navigational hazards, information about tides, the structure of harbors and so on. Charts are very important for maritime navigation, it is compulsory in a lot of countries for vessels to carry maritime maps. You can see more on Wikipedia, Nautical Chart, 2012 (website)

Nautical Chart
Figure 1 Nautical Chart Example from Porto Rico

Graphical / Historical Representations

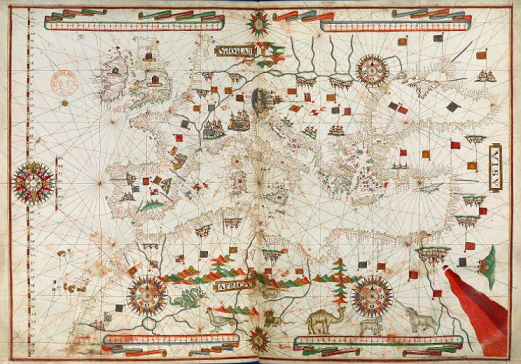
Maritime maps are not something very common in day-to-day life. There are few people that actually know how to use a map. This is because a maritime map is quite different from street navigation maps that everyone uses. Old maritime maps are even harder to read since maps weren’t as exact, some maps were even a bit different from the maps that we have today. Below you can see an example of a maritime map of the Mediterranean see. The picture has been taken from the BNF Cartes Marines Exposition. More old maritime maps can be found on the same website.

Europe Atlas Martines
Figure 2 Europe issue de l’Atlas nautique du monde par Joan Martines, Messine, 1583.

It is quite obvious to see that the above map is quite different from a street navigation map, so how can one read such a map? School of sailing, Powerboat or Maptech provide some guides to reading a nautical chart. Traditional maritime maps are made from paper and have a large format. Nowadays, you can also find maritime maps on electronic devices like computers, tablets, smartphones, but the information that they contain is basically the same. If you have a look at a nautical map you might be surprised that there are a lot of symbols and abbreviations that you do not understand. “A typical nautical chart contains a lot of information about the depth of the water, buoys, lights, dangerous areas, hazards, quality of the bottom for anchoring” (School of sailing, 2012, website). The map also contains information about “chart datum, the projection method, tides and currents, and who made the chart” (School of sailing, 2012, website) and, maybe the most important part, the traffic lanes. Once a boat gets near a harbor, it is quite common that the maritime map contains traffic lanes. These lanes are usually for very large ships which can help other sailors to find them when the weather conditions and the visibility are very bad. For a more detailed insight on how to read maritime maps, the links provided earlier are a good start.

Logbooks

“A logbook was originally a book for recording readings from the chip log, and is used to determine the distance a ship traveled within a certain amount of time. The readings of the log have been recorded in equal times to give the distance traveled with respect to a given start position.” (Wikipedia, Logbook, 2012) (website) These books were used to estimate the position of the ship and all specific information about the cruise were stored inside. This source of information was also gathered from the first cartographers to try to map representations of the coasts and of the world. There are also the logs from the commercial harbors which can be an amazing source of information because we find the name of the ships and the date of their arrival and departure. Gathering all these sources of data, this creates the possibility of mapping virtually the traffic of all ships.

The Mercator Projection

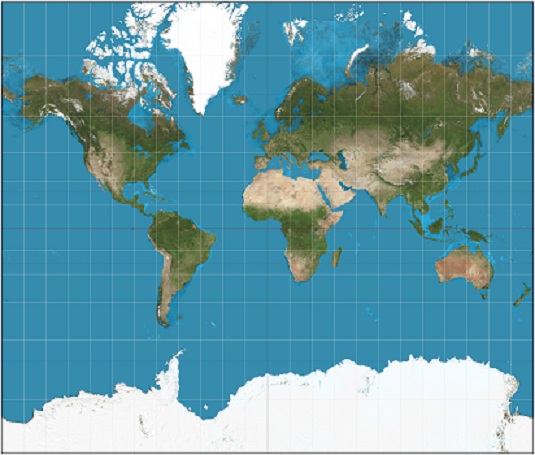
“The Mercator projection is a cylindrical map projection presented by the Flemish geographer and cartographer Gerardus Mercator in 1569. It became the standard map projection for nautical purposes because of its ability to represent lines of constant course, known as rhumb lines or loxodromes, as straight segments which conserve the angles with the meridians. While the linear scale is equal in all directions around any point, thus preserving the angles and the shapes of small objects (which makes the projection conformal), the Mercator projection distorts the size and shape of large objects, as the scale increases from the Equator to the poles, where it becomes infinite.” (Wikipedia, Mercator Projection, 2012) (website) This projection is an important discovery because all the maps that were designed before this projection system are not adapted to be fit on the globe for a visual representation. The deformations would be too large and too irregular to be fitted. The map won’t be well projected and will look ugly.

Projection Mercator
Figure 3 Mercator Projection between 82°S and 82°N

Projects : OpenSeaMap

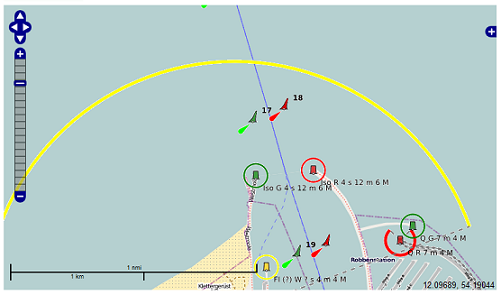
An interesting project about maritime maps is Open Sea Map. “Open Sea Map is a worldwide open source project for creation of a free nautical database.” (Open Sea Map Wiki, 2012) (website) This project is a sub-project of the other well-known mapping project, Open Street Map.  The Open Sea Map will display lighthouses, lateral buoys, cardinal marks and many other navigational aids. Ports are described in much more detail; the map contains all the facilities like port wall, pier, walkways, docks, fueling stations and so on. This map is based on the Open Street Map and is provided as an overlay to the standard navigation map. Below you can see a picture of how the map looks like.

OpenSeaMap
Figure 4 OpenSeaMap

Projects : Navigocorpus

So how does one get from an old maritime map to a modern computer aided representation? Just looking at an old maritime map and trying to convert it to a modern map is a very difficult and tedious job. It requires a lot of experts in history, Geographic Information Systems (GIS), cartographers and maybe others. Navigocorpus is a research project founded by the French National Research Agency. Some of the goals of this project are: creation of a fully searchable on-line database of European maritime shipping in the seventeenth to early nineteenth centuries, creation of a standard for data entry, editing and analysis of historical maritime shipping records. This project has appeared due to research in the following directions: collecting and editing existing databases on historical maritime shipping, a general structure for historical maritime shipping data, GIS database features for maritime maps and training on how to use Navigocorpus for future research. A more detailed description of the project can be found on the Navigocorpus website.

The Navigocorpus database has a structure that was built from scratch; it is designed to accommodate historical maritime data. The main components of the database structure are Points, Cargoes, Taxes and Actions, which are all linked together by means of some unique identifiers. The idea is that a ship movement registration contains information about the route of a ship. The ship movement is connected to a point of observation and if not specified otherwise the registration of the ship will be strongly connected to the point of observation. A very important element in the database is the uniform point definition fields, which are described in detail. The uniform point is used to describe a geographical location.

As we have seen so far, translating old maritime maps to modern nautical charts require a lot of work and a good understanding of the map itself. Luckily, a few existing projects have already started doing research in this direction so one has a starting point from which future research can begin.

Projects : CLIWOC

An amazing project is the CLIWOC project, which uses the meteorological data extracted from the logbooks to create an International Maritime Meteorological Database. These logbooks are giving such elements as “wind direction, wind force, precipitation, fog, ice cover and state of sea and sky” (CLIWOK, 2012, website)

CLIWOC Results
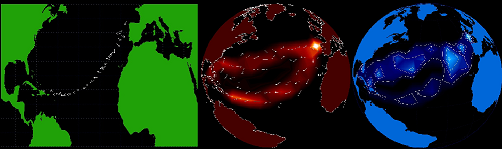
Figure 5 Visualisations from the CLIWOK results ( from left to the right: single cruise informations about windforce and direction, multiple data becoming vector fields for wind, average precipitations estimations)

“The Climatological database for the world’s oceans (CLIWOC) was a research project to convert ships’ logbooks into a computerised database. It was funded by the European Union, and the bulk of the work was done between 2001 and 2003. The database draws on British, Dutch, French and Spanish ships’ logbook records for the immediate pre-instrumental period, 1750 to 1850. (Wikipedia, Cliwok, 2012)”(website)

[Site Description]

HMS Bounty

Le HMS Bounty en 2003 au large de Chicago
Image: AFP

This blog has for purpose to show the progression and the steps on our dh101 Project 19 : Google maps for old maritime maps.

This project has 3 aims or steps:

1. Digitalization
2. Transcription
3. Modelling

The Digitalization phase has been already processed by http://expositions.bnf.fr/marine/index.htm